

Water phase change graph
Moderators: Chem_Mod, Chem_Admin
-
Megan_Ervin_1F
- Posts: 78
- Joined: Fri Sep 28, 2018 12:18 am
Water phase change graph
I don't understand the graph Lavelle drew for water's phase change. What is the difference between the straight lines and the slanted lines? Which line represents the phase change?
Re: Water phase change graph
The X axis represents temperature, while the Y axis represents heat. The slated lines represent the water at a set phase, increasing in temperature. As heat is supplied, the slope increases and the temperature of water rises, but the phase does not change. The straight lines represent water going through a phase change. As heat is supplied, the temperature stays the same, so the heat is going toward supplying the energy required in changing the phase of water rather than raising the temperature.
-
Eva Guillory 2E
- Posts: 44
- Joined: Fri Sep 28, 2018 12:22 am
Re: Water phase change graph
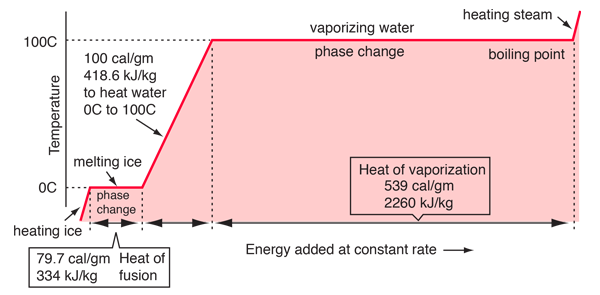
In this graph, the straight lines represent phase changes (where temperature is constant), and the slanted lines represent an increase in temperature.
-
dgerges 4H
- Posts: 65
- Joined: Fri Sep 28, 2018 12:24 am
Re: Water phase change graph
the horizontal lines represent the phase change and the length of the line represents the energy added over time
-
JiangJC Dis2K
- Posts: 72
- Joined: Fri Oct 12, 2018 12:16 am
Re: Water phase change graph
The slanted lines show and include all temperatures where only one state exists (ex. solid, liquid, gas). While the straight lines show melting/vaporization. Therefore, at that temperature, both phases that it is in between are present. Think about when ice is melting. It does not immediately go from solid to liquid. It melts slowly so there is a mix of both states. On the flat lines, at that temperature, the graph is indicating that both phases could be present.
-
Tatum Keichline 2B
- Posts: 64
- Joined: Fri Sep 28, 2018 12:26 am
Re: Water phase change graph
the slanted lines are in their own/same state, while the straight lines represent the phase change (sol->liq->gas)
-
Shreya_Bharadwaj_1D
- Posts: 38
- Joined: Fri Sep 28, 2018 12:22 am
Re: Water phase change graph
The lines with a zero-slope represent an increase in temperature for a substance at a single state and the lines with positive slopes represent phase changes
Return to “Phase Changes & Related Calculations”
Who is online
Users browsing this forum: Google [Bot] and 8 guests